

Overview
For the past several months, I’ve been working on a global enterprise content management solution Blue Fish built for a Fortune 100 client. The system serves as the document repository for tens of thousands of sales and marketing users, spanning dozens of countries and supporting eight languages. This is a critical business application that is always being used by someone somewhere. There is no room for application outages and documents must always be available.
The solution relies heavily on Documentum, and a number of services and features are critical to proper functioning. These include:
- The Documentum Content Server
- Site Caching Services (SCS)
- SCS Post-Syncronization Scripts
- Documentum Workflows
- Media Transformation Services (MTS)
- Web Publisher and Documentum Administrator
- The Documentum LDAP Synchronization Job
Due to the necessary complexity of the overall system, we knew that a dedicated support group and an industry-leading monitoring solution would be required to ensure smooth operations. We therefore worked with our client to ensure that the IT infrastructure was robust and launched the application with a suite of monitors which confirm that machines are up, that services are running, and so forth. However, we soon found that this type of high-level monitoring was not sufficient given the complexity and criticality of the application.
This article gives some insight into the challenges we encountered and the solutions we implemented to monitor this critical application. Please note that this article assumes familiarity with some technical aspects of Documentum.
Support Infrastructure and Challenges
As previously mentioned, the application has a dedicated support team which utilizes a monitoring tool called OneSight from Empirix. This tool has the ability to monitor typical server statistics, such as availability, memory usage, disk usage, etc. It also has the ability to monitor Windows services and check URLs for expected responses.
Even though we launched with monitors for nearly every service, machine, and website involved in the architecture, this monitoring proved insufficient. Several production issues arose which highlighted weaknesses in the monitoring infrastructure. For example, we found cases where service monitors were showing success even though the service was hung, and we found instances where HTTP monitors showed success when the web component they were monitoring had critical errors.
Although Documentum provides out of the box notifications for notable repository events, such as job failures, these didn’t meet our needs, either. In the client’s environment, these notifications are directed to an email address which is intended to be checked regularly by the support team. In practice, this was difficult to manage. The appropriate response from the support team can vary drastically depending upon the severity of the problem being reported, and often times high priority notifications would get lost among less important ones. Also, reviewing an email inbox introduced a manual delay and increased possibility for human error.
Finally, given all the integration points across the system, the team sometimes had trouble answering the question of whether there were any issues across the system and pinpointing a component which was not functioning properly.
Monitoring Solution Overview
In response to these challenges, we took a big picture view of the architecture and designed a monitoring solution. This solution leveraged the existing monitoring infrastructure, but added custom monitoring components tightly integrated with the system to provide insight into whether things are not only running, but are successfully performing their functions.
The monitoring solution still utilizes Empirix for monitoring non-application-specific things. This includes machine availability, CPU usage, memory usage, free hard disk space, and so forth.
For monitoring items that are more tightly coupled to application logic and architecture, we created a custom application health dashboard. This dashboard was simple to create and consists of a single JSP page served by the web application itself. The data for the dashboard comes from a collection of monitoring modules (implemented as java classes) which perform business-level checks on the components for which they are targeted. Each of these monitoring modules reports a status of OK, warning, or failure and is displayed as a row on the dashboard. The dashboard also displays an overall application status which represents a rollup of certain critical modules.
We then setup URL monitors in Empirix for our application health which hit this application health dashboard and inspect the page for certain key strings, such as “APPLICATION STATUS: FAILED”. When these monitors detect a failure, they create support queue items for the support team. Individual modules can be queried to allow fine grain monitoring and severity reporting. In the case where the overall application status shows as failed, we report at the highest severity.
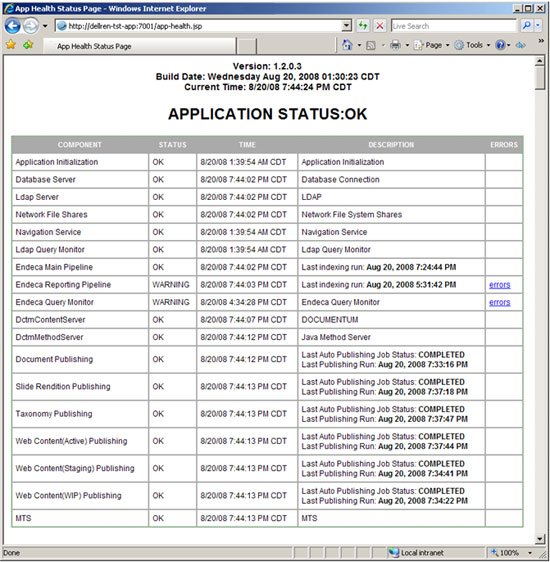
Figure 1:
Screen shot of section from application health page
Although this custom monitoring solution does indeed overlap with some capabilities of the traditional monitoring tools, it provides distinct benefits which greatly improve the supportability of the system. The solution provides a focused view of the application health and also gives the business team visibility as they wouldn’t normally have access to back-end monitoring systems. This helps them better communicate and manage issues. The solution also provides the application team greater control over monitoring. They have the best understanding of the severity and impact of specific application component issues, and the dashboard gives them immediate insight which helps expedite resolution of issues.
Documentum Integration Points
The monitoring solution is broadly scoped, covering almost all of the external processes and application components that interact with the core Documentum services. However, to keep the discussion focused, the rest of this article focuses on the strategies employed for monitoring the Documentum components.
Content Server
The support team had already setup Empirix monitors for the Content Server host and Windows service. We augmented this with a module that establishes a connection to the repository and executes a simple query via Documentum Foundation Classes (DFC). This connectivity is verified whenever the application health page is served by the web application, and it therefore provides confidence that each app server instance (there are several that run in a clustered environment) is successfully communicating with the content server.
Site Caching Services (SCS) Publishing Jobs
There are several SCS publishing jobs which push out several types of data from the content server for consumption by the web application and other application components. These jobs publish taxonomies (from Content Intelligence Services), web content, and -most critically-documents which have been approved for distribution. Implementing monitoring for these publishing jobs was especially important, as multiple issues had been experienced where publishing jobs failed or hung, and the support team wasn’t aware until users started complaining!
To prevent this problem, we built a generic module that can check on the status of any web publishing job. This module has logic which queries the repository tables to determine the status of the last run for the job. Furthermore, it compares the time of the last successful run against a time threshold configured in the application. If the job hasn’t run within the expected timeframe, a failure is reported.
Some additional effort was required to retrieve accurate publishing job status from the repository. The publishing configuration object (dm_webc_config) is updated with the time of the last full publish and the time of the last successful incremental run. However, this object is not updated when the job runs but there is no data to publish. This presents a problem for our monitoring solution as we don’t want to “cry wolf” just because there was nothing to do! Therefore, this monitor also queries the job table (dm_job) to retrieve the last completion time and job status. The job status will be “COMPLETED” if it ran successfully.
SCS Post-Synchronization Script Execution
Some of the SCS jobs kick off post-sync scripts that ensure that application caches are kept up to date when new content and metadata are published. These critical scripts are kicked off by specifying a parameter in the “agent.ini” file on the SCS target machine. In our case, the script executes a java process.
We built logic into this java process to reports on its status by recording success and error events to a special “application health event” table in the database. We have a monitoring module which reads this table, determines when the job last ran, and reports a failure condition if it was unsuccessful. Since this process should be kicked off after the publishing job runs, we also check the time of the last publish to make sure it executes successfully within the expected time interval after that publish. If it hasn’t run, we report a failure.
Java Method Server (for workflows)
Documents posted to the system go through an approval workflow before they are made available to end users. To accomplish this, custom “methods” were developed and integrated with Documentum workflow steps. The Documentum architecture utilizes the Java Method Server (an embedded Tomcat web server) to trigger these methods.
Basic Empirix service monitoring was in place for this Tomcat instance, but it proved insufficient. On several occasions, the service appeared to be running successfully even though our custom methods were not being triggered successfully.
In response, we created an additional custom “health check” method. This method accesses the same application context object that the workflow methods utilize and confirms that it has been successfully initialized. It also performs a simple query to the docbase using DFC to verify that it is properly functioning. We then have a module which invokes this method to make sure it is functioning properly.
Here are the technical details of this monitor for those of you who like that kind of stuff :
The implementation of the health check method is straightforward. In the “execute” function, we perform our checks and throw an exception in case of any errors. This exception will cause the method server to report that the launch failed. The implementation of the monitoring module is a little more involved…It utilizes DFC to create an IDfSession and calls the “apply()” function. We pass the “DO_METHOD” API command and the name of our health check custom method as arguments to this function. This function returns an IDfCollection which includes the attributes “launch_failed” and “timed_out”. If either of these attributes has a value of “T” we report a failure.
Media Transformation Services
Media Transformation Services (MTS) is a Documentum product that falls under the “Content Transformation Services” umbrella. The system utilizes MTS for a couple of specialized functions such as thumbnailing and assembling PowerPoint presentations.
MTS has its own dedicated machine and services, so we setup Empirix monitors to make sure these things are up and running. We also added a health check module which checks the size of the MTS “queue”. We determine what is in this queue by querying the dm_queue table for rows with a name of “dm_mediaserver”, which is the standard name for media server entries. We report an error if we can’t access the queue or we determine that the queue size is building up without any reductions over a configured time interval.
LDAP Synchronization Job
The system is used in a large corporate environment and utilizes LDAP to retrieve user and group information from Active Directory. We rely on the LDAP Synchronization job, which is an out-of-the-box job used to keep user accounts up to date in Documentum.
We have not yet implemented custom monitoring targeted at this component. When the job fails, the standard Documentum notification email is sent to the email address defined for the Content Server. So far, this has been acceptable, but there is room for improvement. The job has failed and we have had issues with particular user accounts as a result. We plan to add a module which leverages the logic used to monitor our publishing jobs. It would query the dm_job table for the time of the run and status for that job.
Web Publisher and Documentum Administrator
Web Publisher and Documentum Administrator are instrumental components of the system, and their availability is therefore critical to the overall health of the system. We have found that standard Empirix monitors setup to monitor the machines and web servers have done a fine job keeping tabs on the health of these two components.
Conclusion
If there is one major theme from our experiences supporting this application, it is:
“Running” does not necessarily mean “working”!
Many monitoring systems simply determine whether a machine is up or a process is running, but this simplistic approach to monitoring only tells half the story (if that!). Make sure your monitoring confirms that critical application components are actually doing what they are supposed to do.
Application monitoring should grow and improve as experience with the application mounts: when problems occur which expose blind spots in the monitoring solution, learn from them and improve the monitoring to ensure a more robust and stable system.

